Weekly Business Review (WBR)
The Weekly Business Review page is your essential dashboard for comprehensive visualizations and analytics of both historical and current key performance indicators (KPIs) on a period over period basis. By navigating to the Analytics and Trends → Weekly Business Review page, you can monitor your business trends across more than 80 different KPIs.
Utilize the Weekly Business Review Dashboard to address key business questions, such as:
Is my year-over-year sales growth on track?
Are my sessions increasing?
How is my conversion rate trending?
Is there an upward trend in my average selling price?
Has the balance between organic and paid traffic shifted recently?
Is my TACOS (Total Advertising Cost of Sales) rising?
And more.
Date Range Selection
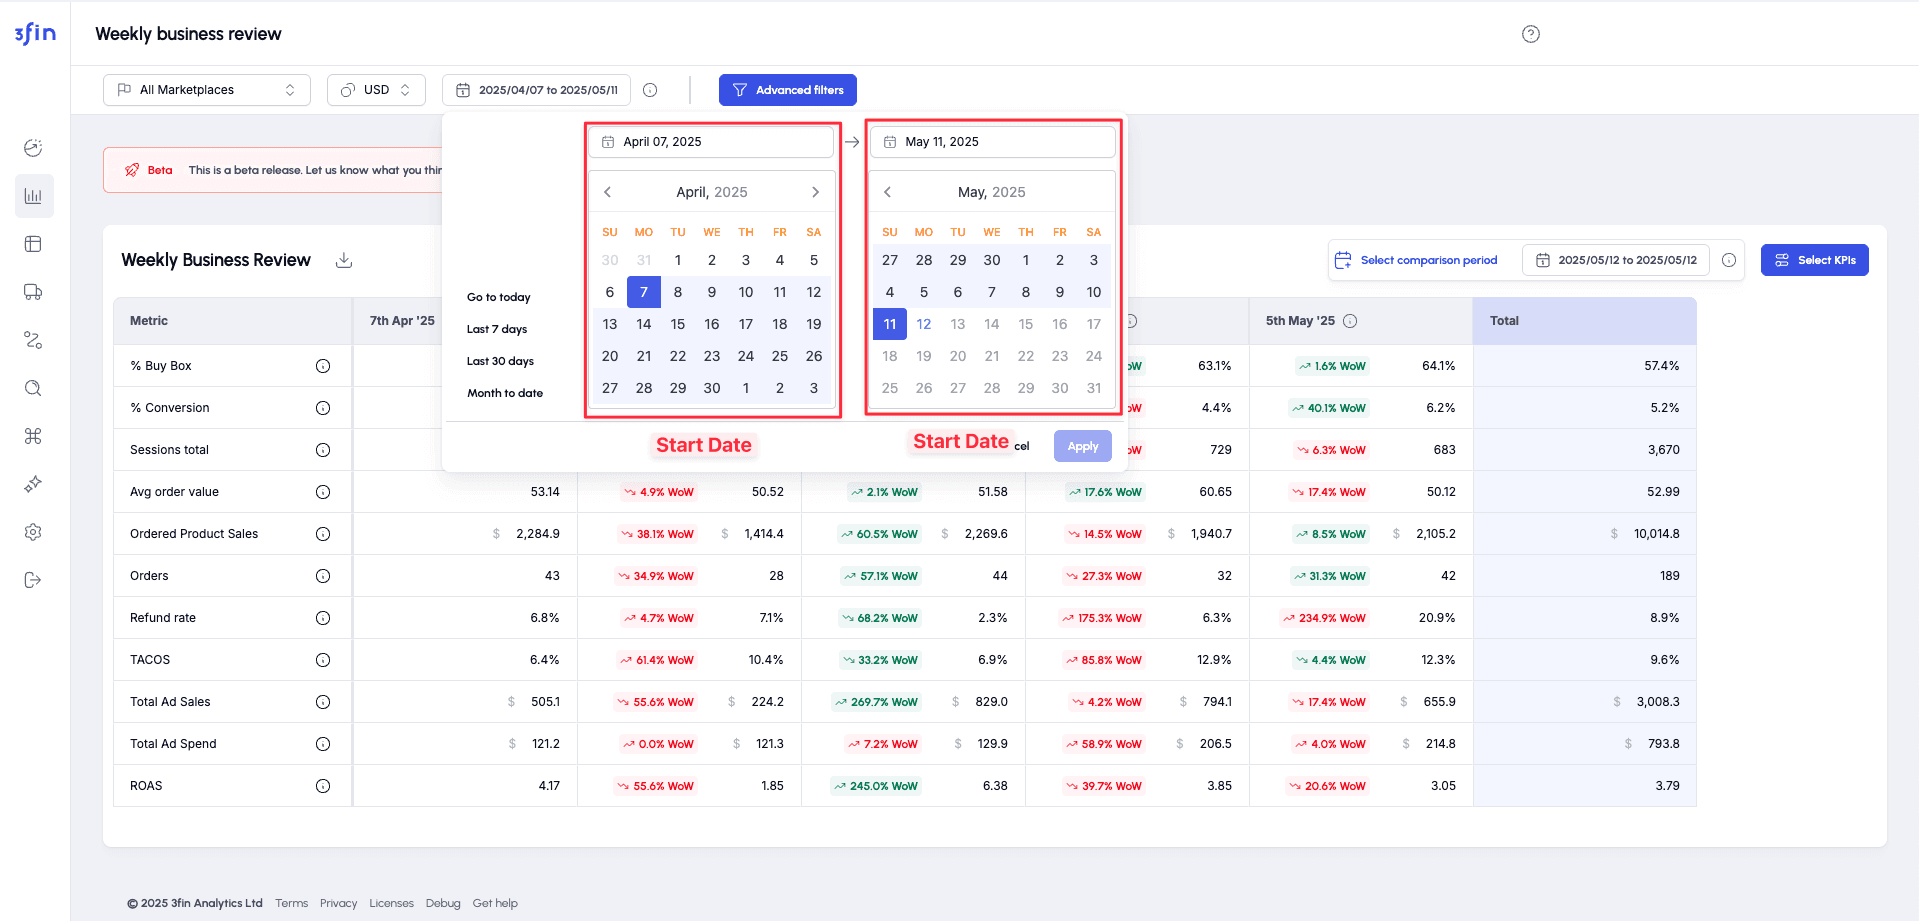
WBR date selection
The initial stage to leverage the WBR dashboard is selecting the desired time period for analysis. The 3fin date selector allows you to choose the start date from the left hand side calendar and the end date from the right hand side calendar.
Depending on your timeframe choice, the default intervals will change:
30 days or less: daily intervals and Day over Day (DoD) comparisons
More than 30 days: weekly intervals and Week over Week (WoW) comparisons
More than 90 days: monthly intervals and Month over Month (MoM) comparisons
Initial data limitations
Due to Amazon Advertising API limitations, 3fin can initially pull 60-90 days of advertising data which limits the date selection to the latest full advertising report. As you continue using 3fin, we will store your advertising data, increasing the historical date range limits.
Advanced filters
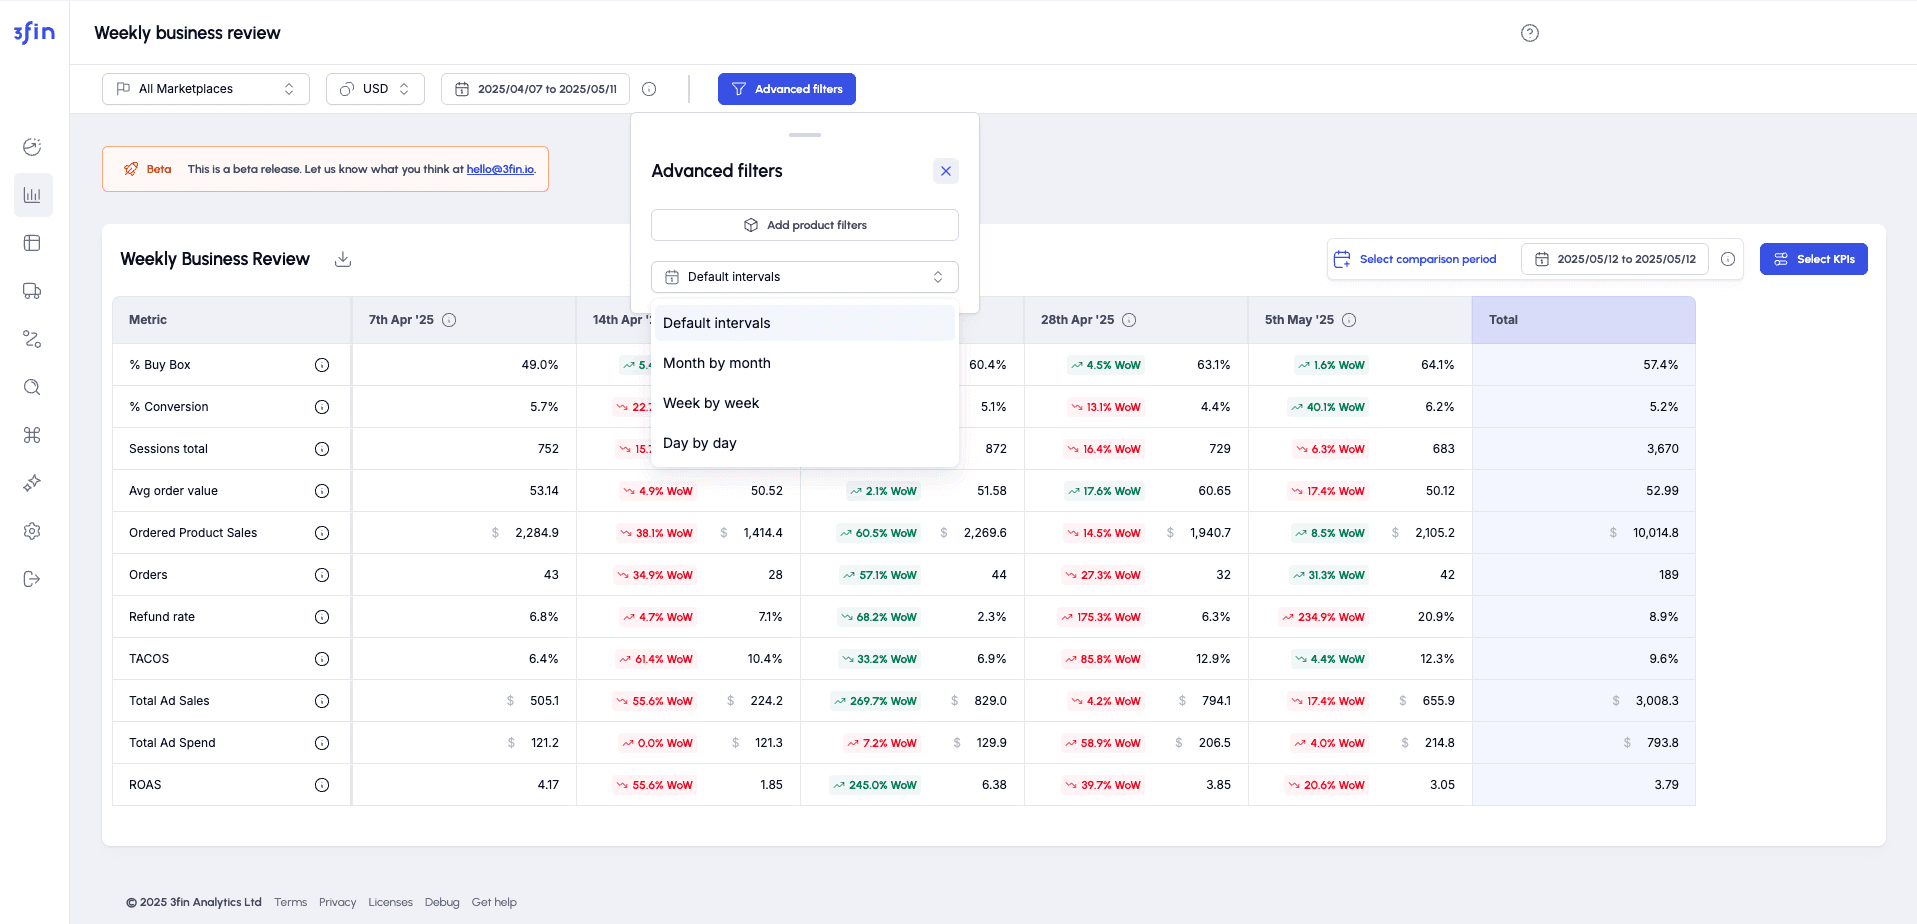
Changing the default interval
Once you have selected your desired time frame for analysis, you might want to change the reporting interval (i.e. you have selected the full month of April but want to visualise data on a weekly basis). By clicking on the advanced filters you can fully customise the intervals between daily, weekly and daily. This will also affect the comparisons accordingly:
Day over day (DoD): will display the data on a daily basis and with day over day comparisons
Week over week (WoW): will display the data on a weekly basis and with week over week comparisons
Month over month (MoM): will display the data on a monthly basis and with month over month comparisons
Select KPIs

Manual KPI selection
Our mission at 3fin is to offer you flexibility to customise the dashboard to fulfill your needs. Using the KPI selector you can select from over 80 KPIs from Sales & Traffic and Advertising. You can select individual KPIs by searching for them, filtering by categories or manually scrolling.
To select or unselect a KPI, just click on the box. Additionally, you can rearrange the order of KPIs by dragging and dropping the KPIs into your desired order.
Custom list KPI selection
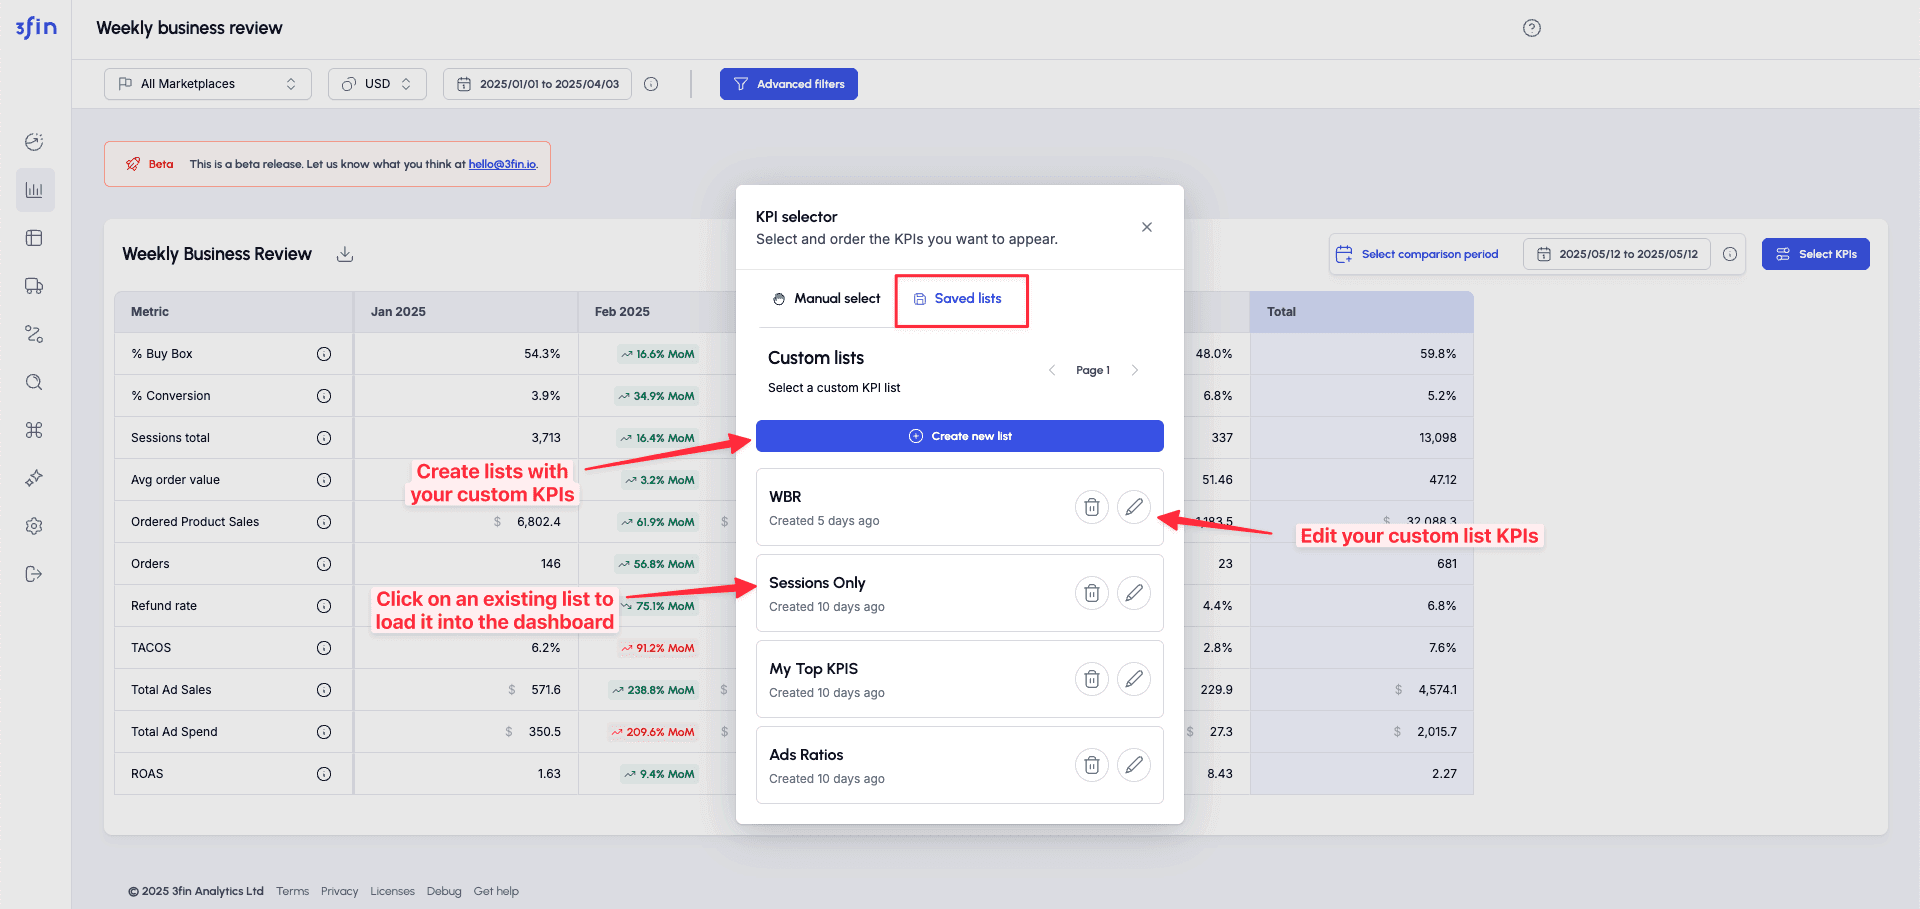
Teams normally look at a diverse range of metrics depending on the analysis and insights that they want to have. In order to streamline KPI selection, you can create your own KPI lists to analyse a particular aspect of the business.
To create a custom KPI list, you can click on “Saved lists” and “Create a new list”. From there, you can select and rearrange the KPIs that you want included in that list and rename it for future reference. Once your list is create, you can click on your list and the KPIs will be loaded into the dashboard.
Recommended lists
Business breakdown (in order of funnel)
BuyBox % - ensure that your offers are visible
Session Browser - gauge how much traffic is coming from desktop for listing optimisation
Session Mobile - gauge how much traffic is coming from mobile for listing optimisation
Session total - track total traffic generation to identify how your strategies are performing
Conversion % - track conversion rate to identify how your strategies are performing
Average order value - track how your pricing and mix affect your traffic, conversion rate and sales
Orders - track the impact of top of the funnel metrics on number of orders
Order Product Sales - track your sales performance and visualise the impact of top of the funnel metrics
Refund rate - identify potential operational and quality issues with your products
Total Ad Spend - identify how your adve
rtising spend is changing and ensure that you are within budget
Total Ad Sales - track the dependency on advertising and the growth or decline paired with your budget
TACOS - measure the advertising efficiency as a percentage of your total sales
ACOS - measure the advertising efficiency as a percentage of ad sales
ROAS - measure the advertising return to identify budget allocation opportunities
Custom comparison periods
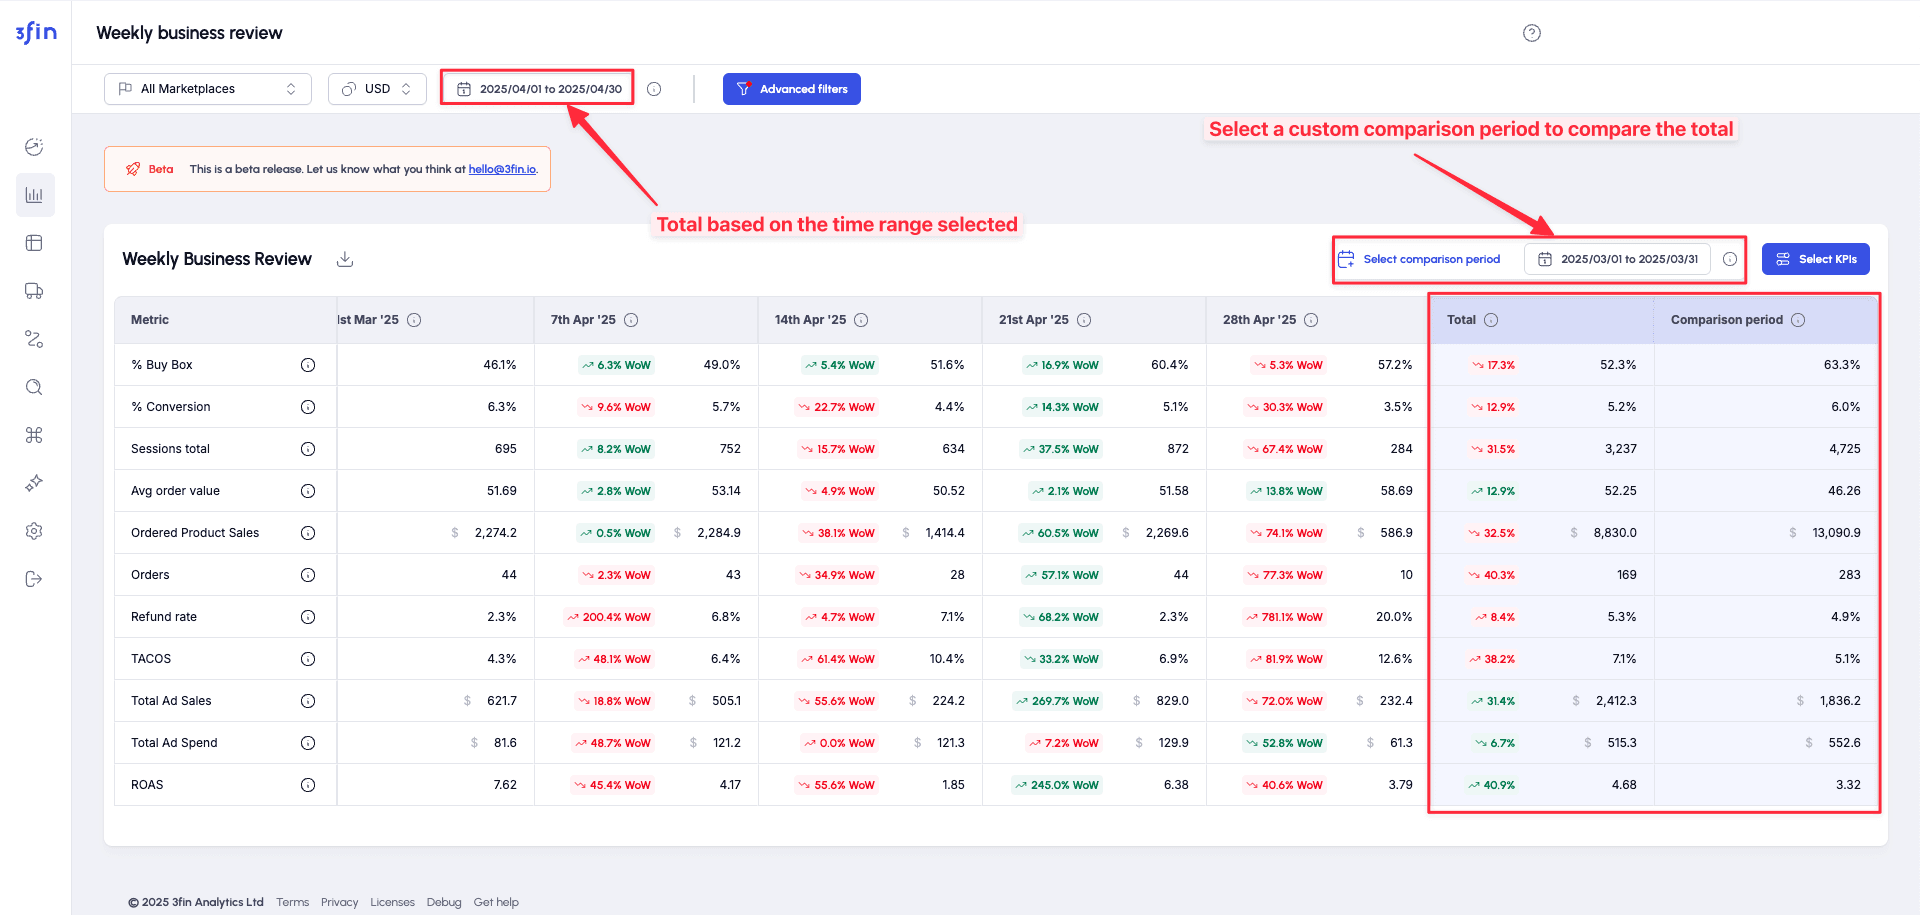
Select a custom comparison period
When you are looking at a specific time frame, such as Prime Day or Black Friday, you might want to compare against the same promotional event on the previous year, but the dates might differ. You can choose a custom comparison period to compare your performance from the selected time period (top bar) against a specific time period.
To select a custom comparison period navigate to the “Select custom period” and click on the calendar to select your comparison dates. This will add a “Comparison period column” at the right end of the table (you might have to scroll right to visualise it). Additionally, you will find automated comparisons in the total column for all the metrics selected in your WBR view.