Order Profit and Loss
Order P&L Overview
The Order P&L shows profits based on the order date (not the shipped date). It excludes cancelled orders and VAT, and updates daily using the latest fee estimates. Use it for daily or weekly view of your profitability.
3fin’s retrieves Amazon’s Order report on a daily basis to get a live view of your sales (excluding cancelled orders). Upon first time connecting to 3fin, we will retrieve the last 16 weeks of orders, to give you at least 3 month of P&L history. The P&L is refreshed daily to reflect the latest status of each order - for instance, cancelled orders get excluded.
Here is a breakdown of the main items you can track using 3fin’s Order P&L:
Units sold and refunded
Average selling price (ASP)
Sales, promotions and net revenue
Cost of Goods Sold (COGS) (* user needs to input COGS)
Estimated Amazon fulfillment and referral fees
Advertising costs
Contribution Margins
Order P&L Filters
Here is an overview of the filters & options available on the 3fin P&L:
Marketplace: let’s you filter the P&L by marketplace. You can quickly (de)select all marketplaces or only select the specific marketplaces for which you want to see your P&L. Note that some costs are charged at an account level and will be shown on the P&L regardless of the marketplace selected.
Currency: select in which currency the P&L should be displayed. Note that 3fin uses fixed exchange rates that are updated on a quarterly basis (meaning historical data will be converted to the desired currency using the latest quarterly exchange rate available)
📢 Q: Which exchange rate does 3fin use to convert currencies to the display currency? A: 3fin uses a fixed exchange rate that is updated on a monthly basis to convert currencies. Historical data will be retroactively changed to account for the new FX rate.
Date Range: filter the Order P&L to show only the desired date range. 3fin shows at least 3 months of historical data (for longer lookback period, use the Transaction P&L which features more than 24 months of data). Note that if the selected date range is less than one month, the P&L will be displayed by day. You can change this with the default interval button by clicking in the arrow in the top right corner. The date selector also features pre-set date ranges to facilitate navigation.
📢 Q: How far back can I see my Order P&L for my business? A: 3fin will retrieve up to 3 months of historical data on the first time you connect your seller central account to 3fin. 3fin saves all historical data and updates order data on a daily basis to ensure that you always have access to the latest financial data. For older profitability data, use 3fin’s Transaction P&L (up to 24 month data)
Advanced Filters: use 3fin’s Advanced Filter button to filter your Order P&L even more granularly. Filter options available are:
Brands: let’s you filter the P&L by brand. If your seller central account features multiple brands, this filter enables you to see the P&L for each brand.
Products: lets you filter the P&L by product(s), tag(s), and custom category
Reading Your Order P&L
Units Sold & Average Selling Price (ASP)
The top section of the P&L provides key data points to help you analyze your business performance:

Units Sold: The total number of units sold during the specified period, excluding cancelled and refunded units.
Units Refunded: The number of units sold in the period that were later refunded. Note that units may get refunded several months after an order was first placed.
Net Units: Calculated as Units Sold minus Units Refunded.
💡 How to Use the Units Data:
Assess whether your sales volume is growing or declining.
Monitor the trend in units refunded and the refund rate. A high refund rate might indicate quality issues and could lead to increased costs.
Gross ASP (Average Selling Price): Calculated as Sales divided by Units Sold. This represents the gross average selling price of your products, excluding any promotions or refunds.
Net ASP (Average Selling Price): Calculated as (Sales - Item Promotions) divided by Units Sold. This represents the net average selling price of your products, factoring in the impact of item promotions and discounts.
💡 How to Use the ASP Data:
Determine whether your ASP is increasing or decreasing over time.
Understand the impact of promotions and discounts on your net ASP.
Analyze ASP data alongside units sold data to identify the drivers of revenue growth or decline.
Top Line: From Sales to Net Revenue
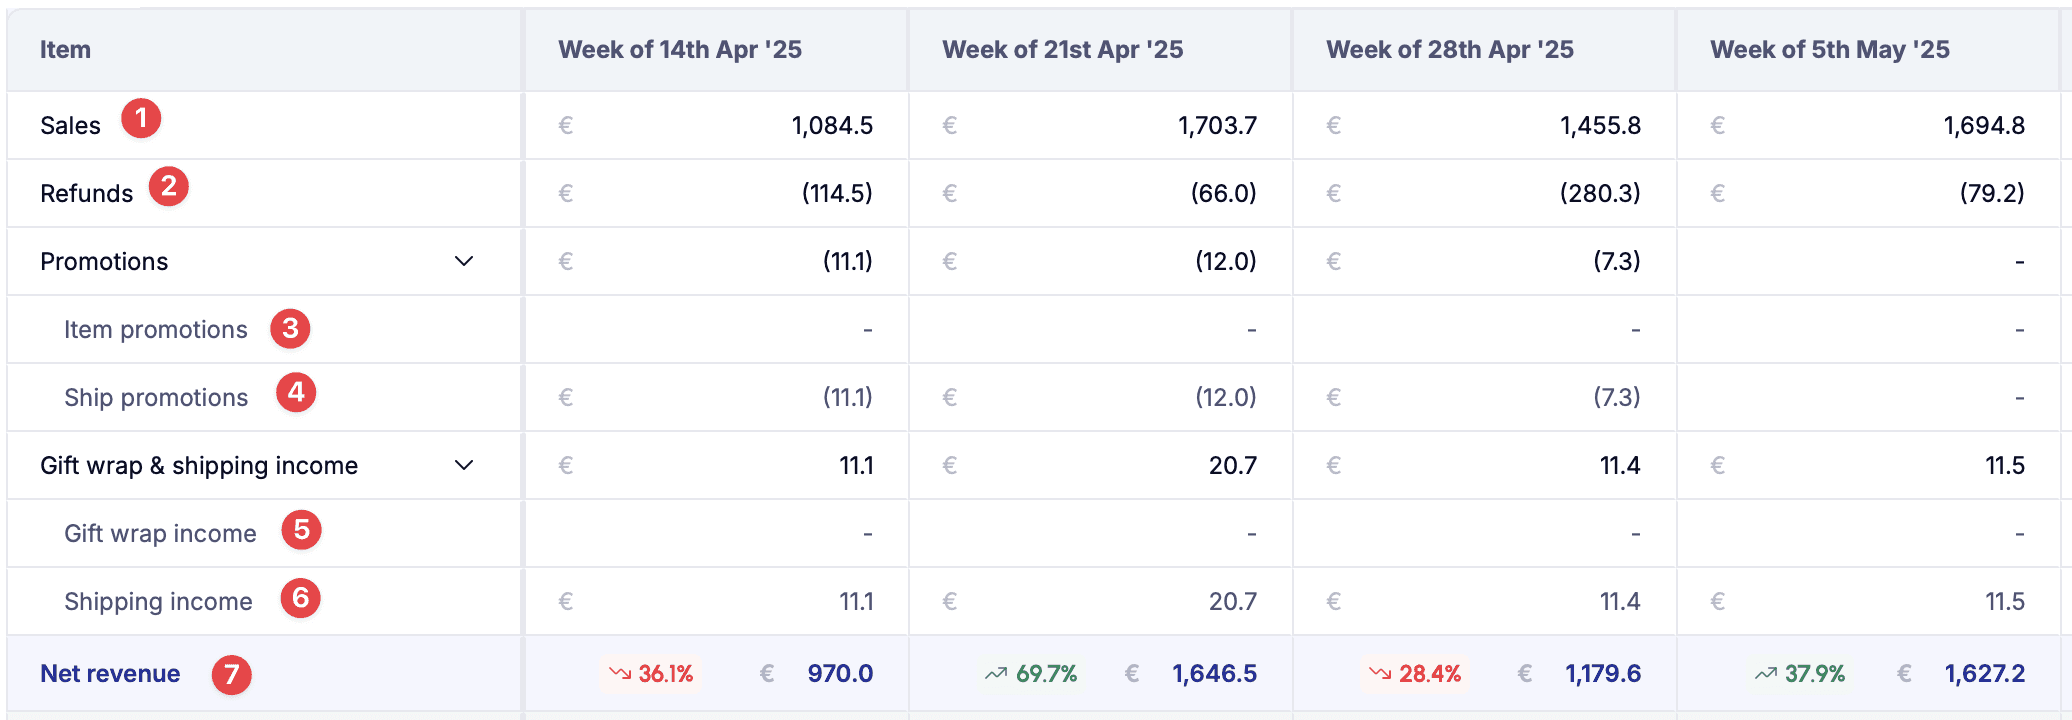
Sales: The total value of products sold, recognized on the order date, net of sales tax/VAT. Canceled orders are not included.
Refunds: The total value of retuned products sold, based on initial order date.
Item Promotions: This includes the cost of offering coupons, running lightning deals, best deals and other promotional activities. Note that item promotions does not include deal fees Amazon charges for running the said deals.
Ship Promotions: This includes the cost of offering a shipping promotion / free shipping.
Gift wrap income: The total income earned from offering gift wrap services.
Shipping income: The total income earned from offering shipping services.
Net Revenue: The total revenue generated by your business after deducting refunds, promotions, and Giftwrap & shipping income.
💡How to use this data? Net revenue is a crucial indicator of your business's health. While increasing sales is important, it’s essential to ensure that refunds and promotions don’t significantly erode your overall revenue.
From Net Revenue to Contribution Margin 2

Cost of Goods Sold (COGS): The total cost incurred to acquire a product and prepare it for sale, including raw materials, labor, shipping, customs duties, taxes, and other expenses related to bringing the product to your warehouse, 3rd Party Logistic (3PL) provider, or Amazon Fulfillment Center.
Contribution Margin 1 (CM1): This metric reflects the impact of pricing, COGS, discounts, refunds, and product mix changes on your profitability. A decline in CM1 or CM1 % can signal various issues that require attention: Is your net revenue decreasing? Are your COGS increasing faster than your sales?
Referral fees estimate: The commission charged by Amazon for each product sold on its marketplace. For most products, the referral fee is 15%. 3fin estimates the referral fee based on recent referral fee amount charged for your SKU.
FBA fulfillment fees estimate: For sellers enrolled in the Amazon FBA Program, Amazon charges a fixed fulfillment fee based on the product’s dimensions and weight. 3fin estimates the fba fullfillment fee based on recent fba fee amount charged to your SKU.
Contribution Margin 2 (CM2): This metric helps you understand how Amazon’s platform fees- such as referral and fulfillment fees - impact your profitability.
Advertising: From CM2 to CM3
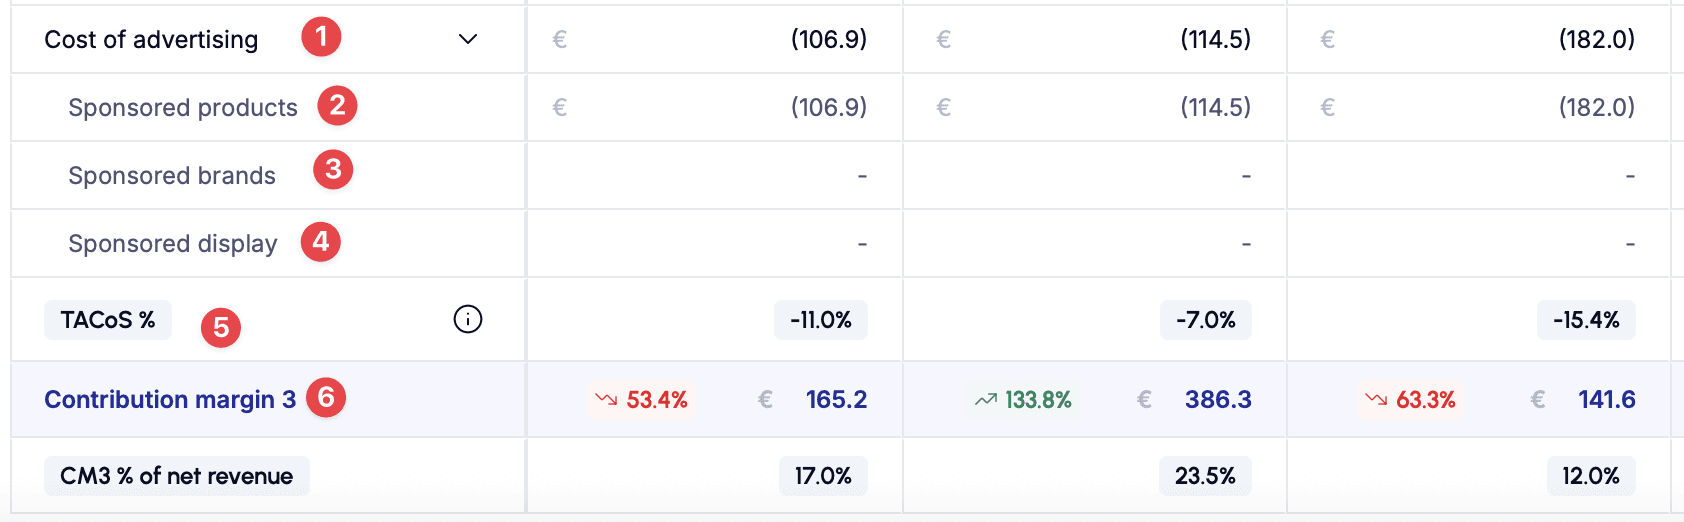
Cost of advertising: The total “pay-per-click” (PPC) fees charged by Amazon to sellers and vendors for advertising their products on the Amazon platform. Amazon offers several advertising options, including sponsored product ads, sponsored brand ads, sponsored display ads, and sponsored television ads which are all tracked in the P&L.
Sponsored products: the total “pay-per-click” (PPC) fees charged for sponsored product advertising
Sponsored brands: the total “pay-per-click” (PPC) fees charged for sponsored brand advertising
Sponsored display: the total “pay-per-click” (PPC) fees charged for sponsored display advertising
TACoS %: Total Advertising Cost of Sales, calculated as Cost of Advertising / Net revenue
Contribution Margin 3 (CM3): The CM3 represents the amount of revenue left after paying all costs to acquire, sell, and advertise your product on Amazon. Aim for at least 20% CM3 - of course the higher, the better!
Order P&L FAQ
Why is the Order P&L not showing any cost of advertising for some historical months?
When you first connect 3fin to the Amazon Advertising account of your business, 3fin will retrieve between 60 and 90 days of historical advertising data from the Amazon API. If you wish to see advertising costs for earlier periods, you will need to enter an advertising expense in the expense dashboard, 3fin will then update the P&L to reflect your manual advertising entry.
Why is the Order P&L showing amounts that are different from Seller Central or other software providers?
3fin’s Order P&L is based on order date and matches Amazon’s order reports. 3fin then enhances the order data by retrieving associated refunds, amazon fees, and cost of advertising. Other software providers may have a different methodology to map costs to each order.
Does the Order P&L include VAT?
No, the Order P&L shows all amounts net of VAT
How accurate is the Order P&L?
3fin provides one of the most accurate order-based profit & loss dashboard on the market:
the Order P&L is based on order date, which is best for tracking daily and weekly profitability
the Order P&L is updated on a daily basis and automatically adjusts for cancelled orders and refunds
How often is the Order P&L updated?
The profit and loss is updated on a daily basis.
In what time zone is the Order P&L?
The profit and loss is displayed in UTC time zone.
How are the Amazon referral fees and FBA fulfillment fees estimated?
For each SKU with sales, 3fin retrieves the most up-to-date referral fee and FBA fulfillment fee per unit. These fees are then multiplied by the number of units sold to estimate total fees at the SKU level. This process is applied across your entire portfolio.
Estimates are calculated over the selected date range using a fixed per-unit fee - meaning the same rate is used for all units sold during that period.